Fundamental vs. Technical Analysis: An Overview
In trading, investing, and finance, two approaches help investors analyze markets and securities: fundamental and technical analysis. Each helps evaluate investment opportunities, and many traders blend both for a more comprehensive view. Fundamental analysis focuses on the quality of an asset, while technical analysis looks at market trends as an indicator of value.
What Is Fundamental Analysis?
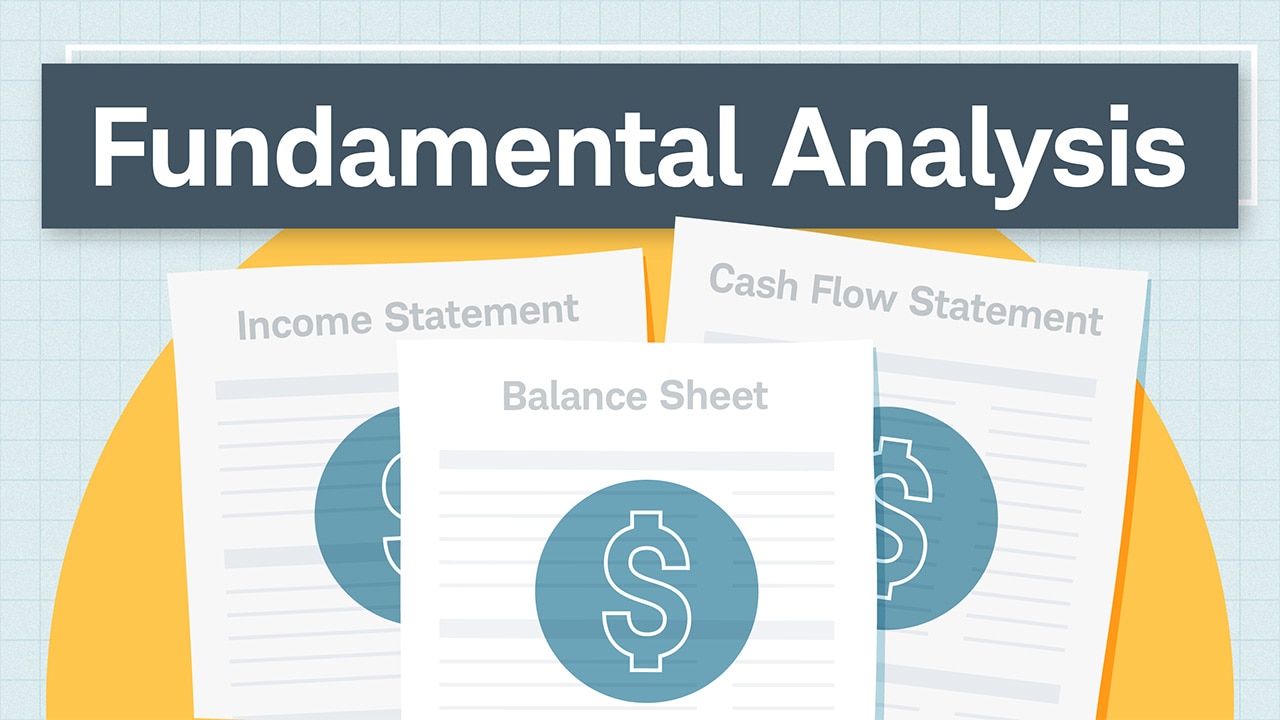
Fundamental analysis is used in finance to evaluate the intrinsic value, the real worth, of a security or whole sectors and markets. For a company stock, fundamental analysis is used to scrutinize income statements, balance sheets, and cash flow statements. Fundamental analysis is generally for those looking for long-term value.
Hence, those performing this kind of analysis are trying to calculate how much the company will make in the future against its present net value. A stock trading below the company's intrinsic value is generally seen as promising, while the opposite is true for those trading below it. The outcome of the analysis can lead to buying, holding, or selling a security.
The Main Tools of Fundamental Analysis
This approach seeks to uncover the intrinsic value of a security, such as a stock or currency, using these main tools:
- Financial statements: These include a company's income statement, balance sheet, and cash flow statement, which provide a financial snapshot and help assess its profitability, liquidity, and solvency. Analysts use these to determine financial ratios, multiples, and other mathematical representations of a firm's financial health.
- Economic indicators: Macroeconomic indicators like gross domestic product growth, inflation, and unemployment rates are used to understand the economic environment in which a company operates. These indicators can affect consumer behavior and, therefore, a company's performance.
- Interest rates: Central bank interest rates can significantly affect an investment's value. Higher interest rates generally lead to lower stock prices, while lower rates boost stock prices.
- News and events: Company news, such as earnings reports, new contracts, and regulatory changes, affect stock prices.
- Qualitative information: This includes details about management quality, industry cycle, competitive advantage, and other non-quantifiable factors that affect a company's stock.
What Is Technical Analysis?
Technical analysis evaluates financial assets, such as stocks, currencies, or commodities, by reviewing the historical price and volume data. Unlike fundamental analysis, which focuses on the intrinsic value of an asset, technical analysis examines the volume and price of shares over time.2
Simplifying more than a little, where those using fundamental analysis portray themselves as the sober-minded investigators uncovering real value in the economy, those who use technical analysis start from the view that markets are inefficient and price patterns and trends in market data can be exploited for potential profit.
The Main Tools of Technical Analysis
Here are the tools most often used in technical analyses:
- Technical analysis indicators: These are mathematical calculations based on price, volume, or open interest to predict future prices. The indicators are generally based on momentum or mean reversion.
- Volume analysis: This studies the number of shares, lots, or contracts traded in a security or market during a certain period.
- Relative strength: This metric compares the performance of an asset to a benchmark to gauge its momentum.
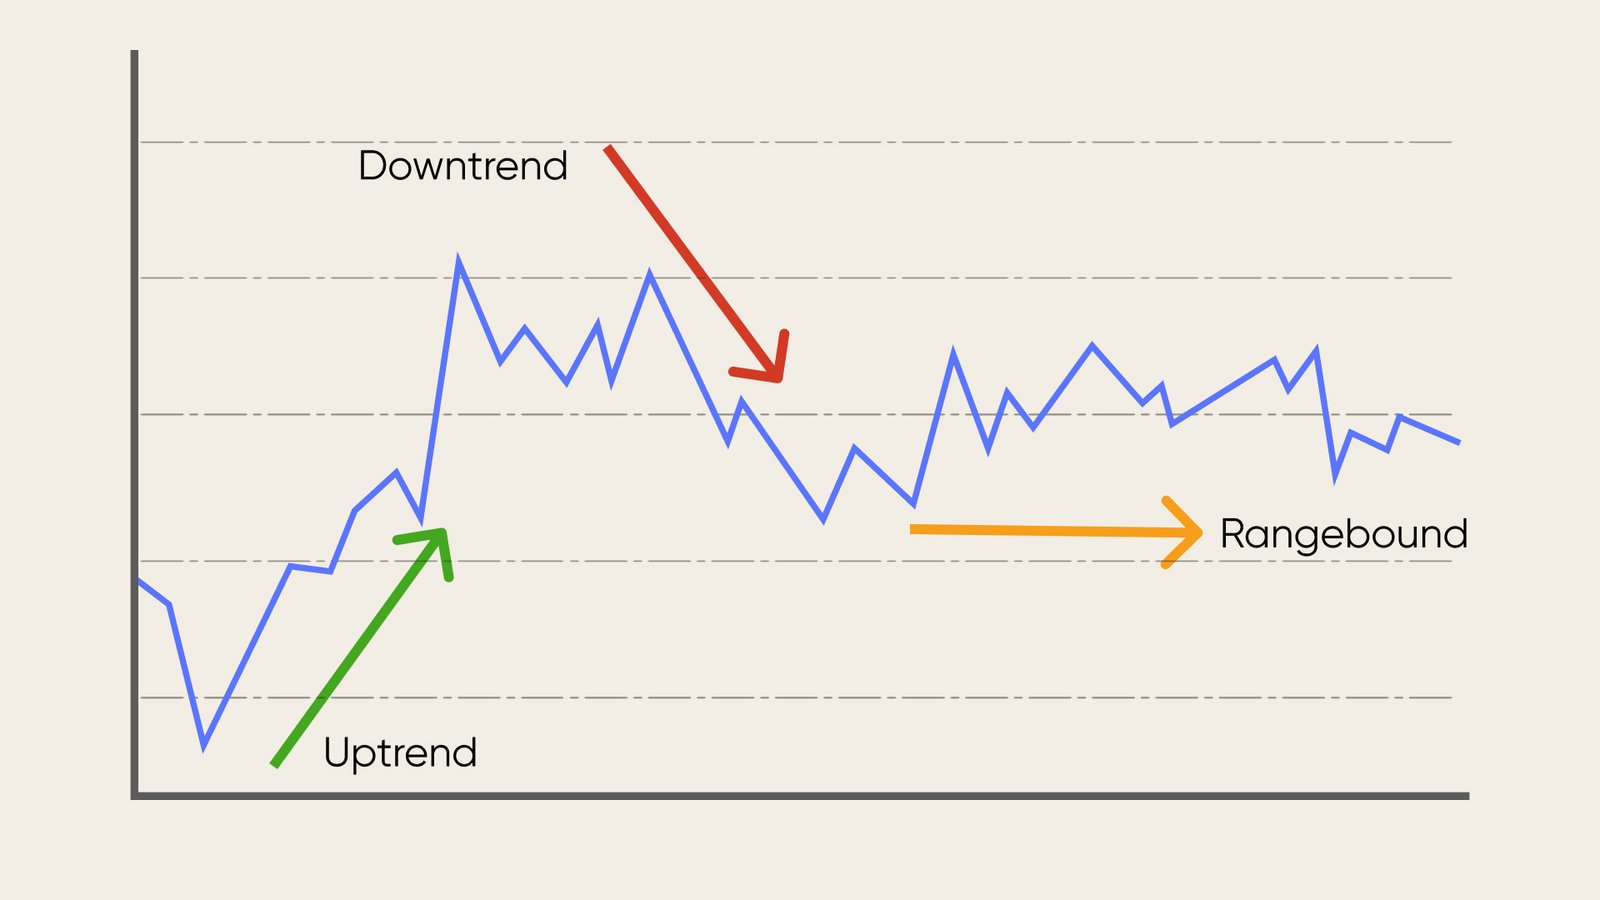
- Chart pattern analysis: The study of price movements in a market pinpoints patterns that can suggest future activity.
- Candlestick pattern analysis: This kind of financial chart used for price movements could indicate investor sentiment, market trends, or reversals of those trends.
- Support and resistance: These are horizontal lines drawn on a price chart to indicate where a security's price will be unlikely to move beyond.
- Trend analysis: This is interpreting past and present moves in the market to predict future asset prices. Historical prices and trading volume are the most often used.
Each element allows investors to analyze a share or market's behavior.
The Pros and Cons of Fundamental and Technical Analyses
The table below provides the pros and cons of fundamental and technical analyses.
Fundamental analysis is a valuable tool for long-term investments but is less adaptable to short-term moves.8 It offers a balanced approach by considering qualitative and quantitative factors, although interpreting them can be subjective. Alternatively, technical analysis provides a quick, visual way to evaluate assets, and it has limits. Traders and investors often used technical analysis with other methods for a more comprehensive strategy.
Blending Fundamental and Technical Analyses
Investors frequently combine the principles of fundamental and technical analyses to make more informed investment decisions. The idea is to leverage the strengths of both to compensate for their weaknesses.
To begin a blended approach, you might initially gauge the intrinsic value of an asset through fundamental analysis. This involves evaluating financial statements, market trends, and other qualitative and quantitative factors. Later, technical analysis can be used to identify the optimal entry and exit points. This involves studying price charts, patterns, and other market indicators.
This approach provides a more complete understanding of an asset or market. It combines the fundamental analysis's risk assessment capabilities with the technical analysis's timing. Thus, it can be suitable for short- and long-term investment strategies.
However, blending fundamental and technical analyses requires a good understanding of both, making your work time intensive. The need to master these two different types of analysis could be overwhelming for some.
Nevertheless, the blended approach is balanced, offering the depth of fundamental analysis and the real-time applicability of technical analysis.
Conclusion:
While doing market analysis as an investor you have to consider both Fundamental and Technical analysis, this will help you in determination of the market direction, and entry zone, to open a position. Or if you don't want to worry about that that's where hedge funds like Blackrock, KNOWN Investments Fund, Fidelity, and others came in to manage your funds, Last but not least never ignore any piece of information.
Comments
Post a Comment